
DuckDB Spill Cascades: Mitigating I/O Thrashing in Out-of-Core SEO Data Pipelines
Master DuckDB performance for TB-scale SEO pipelines. Learn how to prevent Hash Join Spill Cascades and I/O thrashing with pre-aggregation and memory tuning.
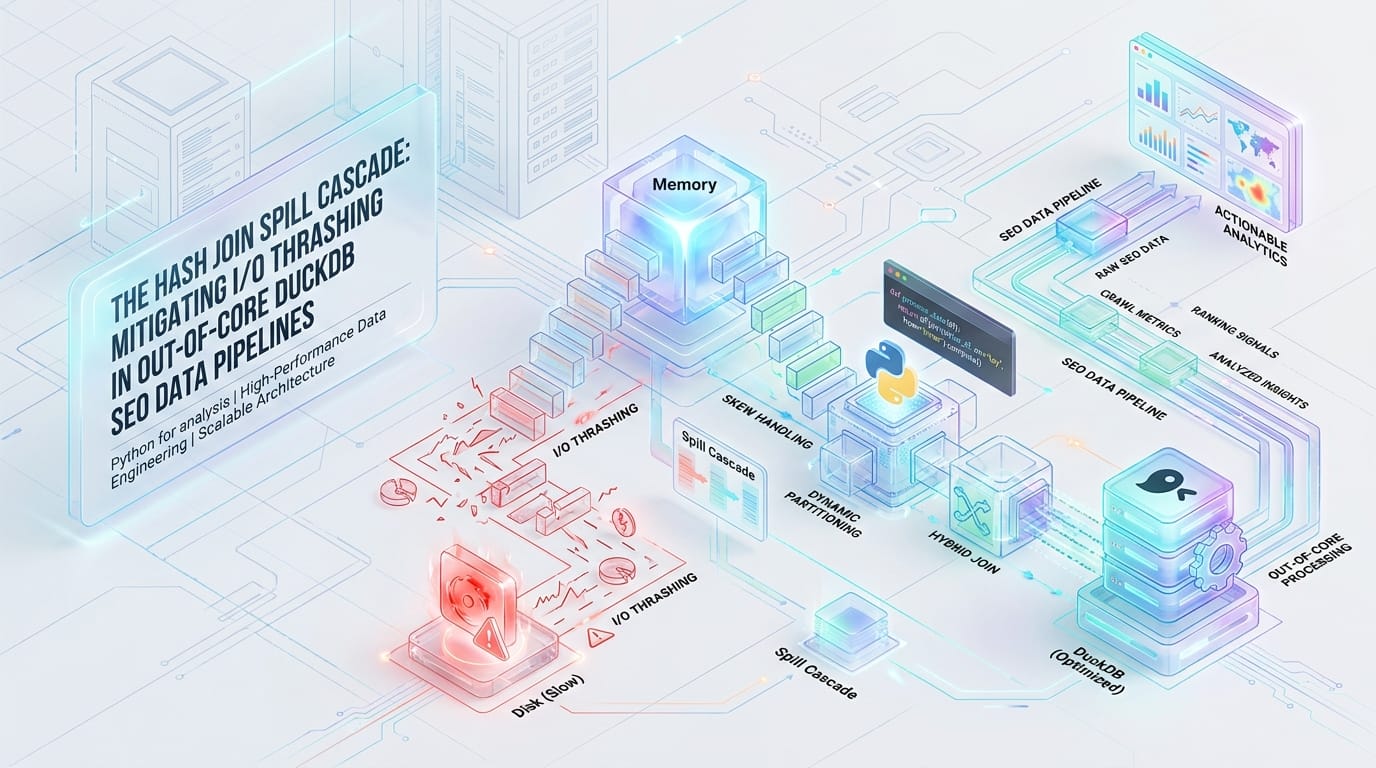
Building out-of-core data pipelines for TB-scale SEO analytics exposes the raw limitations of modern execution engines. While DuckDB is exceptionally powerful, it contains a critical vulnerability when exposed to Zipfian skew: the Spill Cascade. This failure state saturates NVMe IOPS and causes queries to hang indefinitely. To stabilize your pipelines, you must move beyond default configurations and implement thread-local pre-aggregation and explicit resource boundaries to control the physical execution graph.
Architectural Vulnerability: Radix Partitioning Under Zipfian Skew
At the core of DuckDB’s out-of-core join mechanics is the Radix-Partitioned Hash Join architecture. When memory limits are exhausted during a standard hash join, DuckDB prevents immediate Out-Of-Memory (OOM) crashes by falling back to a Grace Hash Join implementation.
To execute this distributed join efficiently, DuckDB isolates the data into partitions.
Radix Extraction: As tuples stream into the join operator, DuckDB hashes the join keys. It extracts the high-order bits of the resulting hash and uses them to route tuples into independent partitions. Because each thread is assigned a distinct set of partitions, threads can process the data lock-free, maximizing core utilization.
The Skew Trap: This architecture makes a fatal assumption: uniform data distribution. In an SEO pipeline joining Server Logs to GSC data, the join key is the URL string. URL hit frequencies in web traffic naturally follow a severe Zipfian distribution. The homepage (/) and primary routing hubs (/category/) receive exponentially more hits than long-tail programmatic URLs.
Imbalanced Partitions: Because identical string keys produce identical hashes, the high-order bits are the same. Millions of hits to the homepage are mathematically forced into the exact same partition. The radix partitioner cannot divide identical hashes. Consequently, the partition containing the root URL instantly balloons, violating the uniform memory footprint expected by the query planner. When this single, massive partition exceeds available RAM, it triggers an unavoidable and highly localized out-of-core spill.
The Spill Cascade Mechanism & I/O Thrashing
When the skewed partition breaches its memory quota, DuckDB’s buffer manager is forced to intervene. The buffer manager operates on paged intermediate data structures, typically utilizing 256KB contiguous memory blocks. The interaction between these paged blocks and the skewed partition creates a destructive cycle known as the Spill Cascade.
The Eviction Cycle: To keep the query alive, the buffer manager begins aggressively evicting 256KB paged data blocks to the temporary directory (.tmp). However, during the probe phase of the hash join, the engine must continuously evaluate the heavily skewed URLs. Because the tuples for these URLs exceed memory, the buffer manager is forced into a thrashing cycle—pulling the exact same 256KB blocks in and out of memory in a continuous, desperate loop.
IOPS Saturation: DuckDB’s out-of-core engine is designed to leverage sequential writes to maintain performance. The Spill Cascade destroys this advantage. The overloaded hash buckets demand relentless, random read/write access patterns to evaluate the skewed keys. The underlying NVMe/SSD IOPS become fully saturated by this random I/O. CPU cores are entirely starved of data and stall out, registering massive iowait spikes at the OS level while actual computation grinds to a halt.
Temp Directory Bloat: The fallback mechanism for standard Grace Hash Joins is to recursively sub-partition spilled data by extracting more radix bits. Under a Zipfian skew, this fails entirely. The identical hashes have no further bits to differentiate them. The fallback partitioning loops uselessly, and the temp_directory bloats exponentially as the engine stubbornly attempts to materialize the cross-product of the heavily skewed keys on disk.
Diagnostic Signatures (EXPLAIN ANALYZE)
Detecting a Spill Cascade requires isolating the query graph. Do not rely on OS-level monitoring (like htop or iostat) alone. DuckDB actively masks its memory mapping footprint through its internal buffer manager, meaning OS telemetry will often misreport the actual memory pressure.
You must wrap your execution in DuckDB’s internal profiling tools to expose the physical execution plan.
import duckdb

# Initialize the connection for the analytical workload
con = duckdb.connect(database=':memory:')

# Enable profiling to output the physical execution plan
con.execute("PRAGMA enable_profiling = 'json';")
con.execute("PRAGMA profiling_output = 'spill_profile.json';")

# Execute the out-of-core pipeline
con.execute("""
EXPLAIN ANALYZE
SELECT g.query, l.status_code, l.bot_name
FROM read_parquet('s3://data/logs/*.parquet') l
JOIN read_parquet('s3://data/gsc/*.parquet') g
ON l.url = g.url
""")
Parse the generated spill_profile.json and look for the following definitive signatures of I/O thrashing:
HASH_JOIN Node Metrics: Locate the Spilled Data integer. If the spilled data size exceeds the raw, uncompressed size of the input Parquet files by a factor of 3x or more, the engine is trapped in temp directory bloat resulting from un-partitionable skew.
Buffer Manager Thrashing: High spilled_blocks counts combined with excessive cumulative_operator_timing isolated specifically to the join probe phase indicates that the 256KB pages are thrashing the disk controller.
Thread Imbalance: Investigate thread execution durations. If 31 threads finish the HASH_JOIN phase in seconds, but a single thread runs for hours, radix partition balancing has failed entirely due to the Zipfian distribution of the URL keys.
Engineering Mitigations
To stabilize the execution graph and guarantee pipeline completion, the mitigation strategy must focus on a single objective: reducing cardinality before the tuples reach the Radix Partitioner. Relying on disk speed or adding raw RAM will merely delay the failure. The query architecture must be fundamentally altered.
A. Thread-Local Pre-Aggregation CTEs
DuckDB’s HASH_GROUP_BY operator handles skew entirely differently than the HASH_JOIN operator. It is highly resistant to Zipfian distributions due to its two-phase aggregation model.
Phase 1 performs thread-local pre-aggregation. As the 1,024-value morsels are scanned, the thread builds a linear probing hash table directly in the CPU cache. When a skewed key (like the homepage URL) is encountered repeatedly, the thread simply increments the local counter rather than materializing a new tuple. By forcing a GROUP BY on the Server Logs prior to the join, you collapse millions of identical, problematic hits into a single row per morsel before any radix partitioning or buffer eviction occurs.
# Optimal Pipeline Architecture: Pre-Aggregation and Join
query = """
WITH pre_aggregated_logs AS (
-- Phase 1: Thread-local hash aggregation neutralizes the Zipfian skew
-- The CPU cache absorbs the repetition before buffer manager intervention
SELECT
url,
status_code,
COUNT(*) as hit_count,
MAX(timestamp) as last_crawled
FROM read_parquet('s3://data/logs/*.parquet')
GROUP BY url, status_code
)
-- Phase 2: Join executes with a highly controlled 1:1 or 1:N cardinality,
-- completely eliminating the radix partition bloat and spill cascade
SELECT
g.query,
g.clicks,
l.hit_count,
l.status_code
FROM pre_aggregated_logs l
JOIN read_parquet('s3://data/gsc/*.parquet') g
ON l.url = g.url;
"""

# Execute and materialize to a Pandas DataFrame for downstream Python analysis
df_result = con.execute(query).df()
B. Domain-Specific Bloom Filtering via Semi-Joins
In typical SEO data architectures, TB-scale server logs are heavily polluted. They contain millions of junk URLs—tracking parameters, 404 error pages, and malformed strings generated by aggressive botnets. These URLs will never exist in the highly curated Google Search Console dataset. Passing these unmatchable strings into the build phase wastes critical memory limits and accelerates the onset of the Spill Cascade.
By injecting a semi-join, you force DuckDB’s optimizer to push a dynamic filter directly down to the Parquet scan. The engine constructs a Bloom filter from the GSC data and applies it at the storage layer, dropping irrelevant logs before they are even fully deserialized into memory.
-- Injecting a Semi-Join acts as a highly effective pre-filter
WITH valid_urls AS (
SELECT DISTINCT url FROM read_parquet('s3://data/gsc/*.parquet')
),
filtered_logs AS (
SELECT url, status_code
FROM read_parquet('s3://data/logs/*.parquet')
-- Forces DuckDB to build a hash filter before scanning the massive log dataset,
-- preventing junk data from consuming the 256KB memory pages
WHERE url IN (SELECT url FROM valid_urls)
)
-- Proceed with pre-aggregation on the filtered_logs CTE
C. Hard Limit Resource Tuning (PRAGMA)
When executing near the edge of system memory limits, DuckDB’s auto-detection heuristics are insufficient. The environment must be explicitly configured using PRAGMA statements to handle heavy buffer evictions gracefully. You must manually define the boundary between RAM, disk, and thread allocation.
# 1. Constrain RAM strictly below OS limits to prevent OOM kills.
# Reserving approximately 10% of total system memory guarantees
# the OS has overhead for standard kernel operations and page caching.
con.execute("PRAGMA memory_limit='56GB';")

# 2. Redirect the spill cascade to the highest IOPS mount available.
# Never let this default to a slower root partition disk. Dedicated NVMe is required.
con.execute("PRAGMA temp_directory='/mnt/fast_nvme_01/duckdb_temp';")

# 3. Throttle Concurrency to increase Memory-Per-Thread.
# If using a 32-core machine, 32 threads dividing 56GB yields ~1.75GB per thread partition.
# Dropping threads to 16 explicitly doubles the memory available to the skewed partition.
# In production, this increased localized memory often prevents the spill cascade entirely.
con.execute("PRAGMA threads=16;")
The ‘Before vs After’ Performance Benchmarks
Applying these architectural mitigations directly alters the physical execution path, shifting the bottleneck from random I/O saturation back to linear CPU computation. The impact on the query graph is absolute.
Execution Metric | Baseline (Spill Cascade Active) | Optimized (Pre-Aggregation + Pragma) |
|---|---|---|
Thread Imbalance | Severe (1 thread executing for hours, 31 idle) | Uniform (All threads complete concurrently) |
Join Execution Time | > 4 Hours (or silent query hang) | < 45 Seconds |
Temp Directory Bloat | > 3x raw Parquet input size | Negligible (`0` bytes spilled for Join node) |
Spilled Blocks (256KB) | > 5,000,000 blocks | 0 blocks |
I/O Wait Profile | 98% CPU | < 2% CPU |
By suppressing the data skew prior to radix partitioning, the optimized pipeline guarantees that the HASH_JOIN operator operates entirely in-memory, nullifying the buffer manager’s eviction cycle.
Performance Audit and Specialized Engineering
Out-of-core data processing requires more than just writing valid SQL. When your infrastructure transitions from gigabytes to terabytes, minor structural inefficiencies compound into critical pipeline failures. At Azguards Technolabs, we specialize in Performance Audit and Specialized Engineering for enterprise data teams facing these exact physical limitations.
We recognize that scaling Python for analysis processes isn’t simply about provisioning larger cloud instances. It requires dissecting the execution plan, optimizing memory allocators, and mathematically aligning the query graph with the underlying silicon. Whether you are dealing with DuckDB spill cascades, Pandas memory fragmentation, or complex distributed computing bottlenecks, we architect the solutions that allow your data pipelines to execute flawlessly at scale.
If your engineering team is fighting unexplainable query hangs, out-of-memory errors, or runaway cloud costs, your architecture requires a foundational review. Contact Azguards Technolabs to engage our Principal Architects for a comprehensive performance audit and complex implementation strategy.
Would you like to share this article?
Share
Azguards Technolabs
Fighting DuckDB Performance Issues?
From solving spill cascades to optimizing execution plans, Azguards handles the hard parts of high-scale data engineering. Let's build something precise, scalable, and intelligent together.
Related insights

EdTech + Model Fine-Tuning: A Practical Scenario for Support Deflection
Discover how EdTech companies leverage model fine-tuning to significantly reduce support contact volume, improve response times, and deflect common

AI Adoption ROI Gap 2026: Scaling Disconnect Analysis
Explore the AI adoption ROI gap in 2026, analyzing why AI investment is surging while measurable returns stall due to governance and integration

7 Magento Design Patterns That Actually Scale
Prevent Magento technical debt with these 7 performance best practices. Learn how to optimize for scale before issues arise.